Crop Disease Detector
Building an AI that identifies plant diseases from a single leaf photo — the problem, the process, and the lessons learned.
It started with a simple question that I could not stop thinking about.
Every year, a significant portion of agricultural harvests in developing countries are lost — not because treatments do not exist, but because plant diseases are identified too late. By the time a farmer notices that something is wrong, the damage has already spread.
That question would not leave me alone. And so I built the answer.
The idea is straightforward: a farmer takes a photo of a diseased leaf, uploads it, and the AI tells them exactly what's wrong — in seconds, without needing a lab, an expert, or expensive equipment.
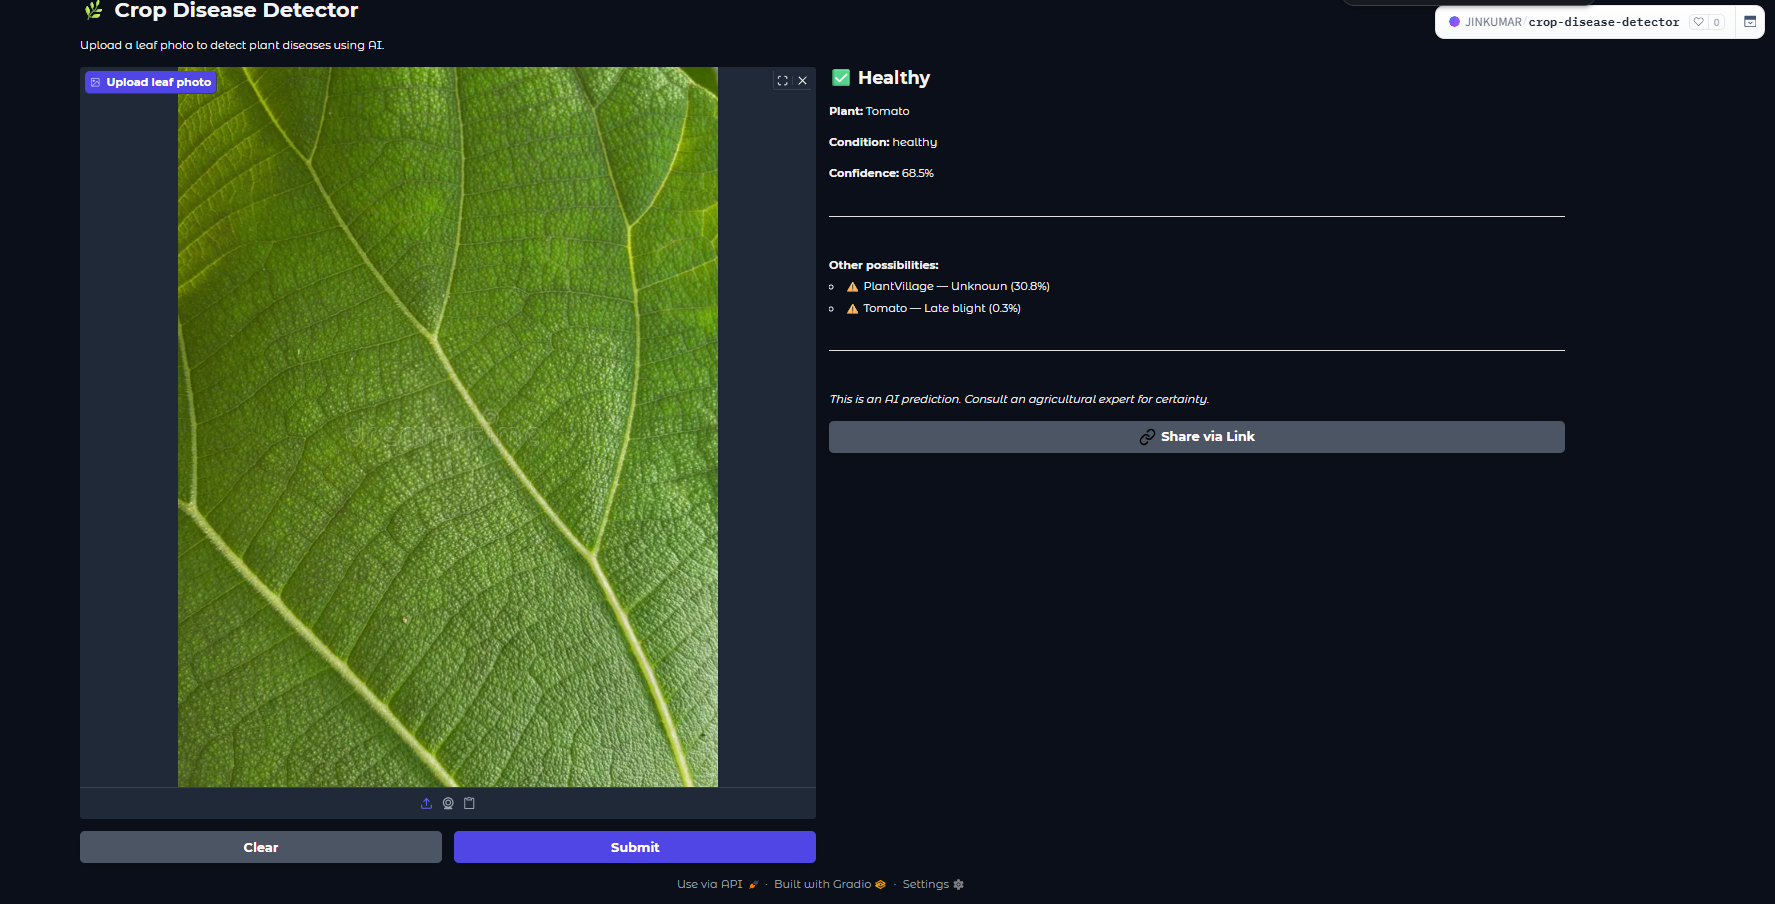
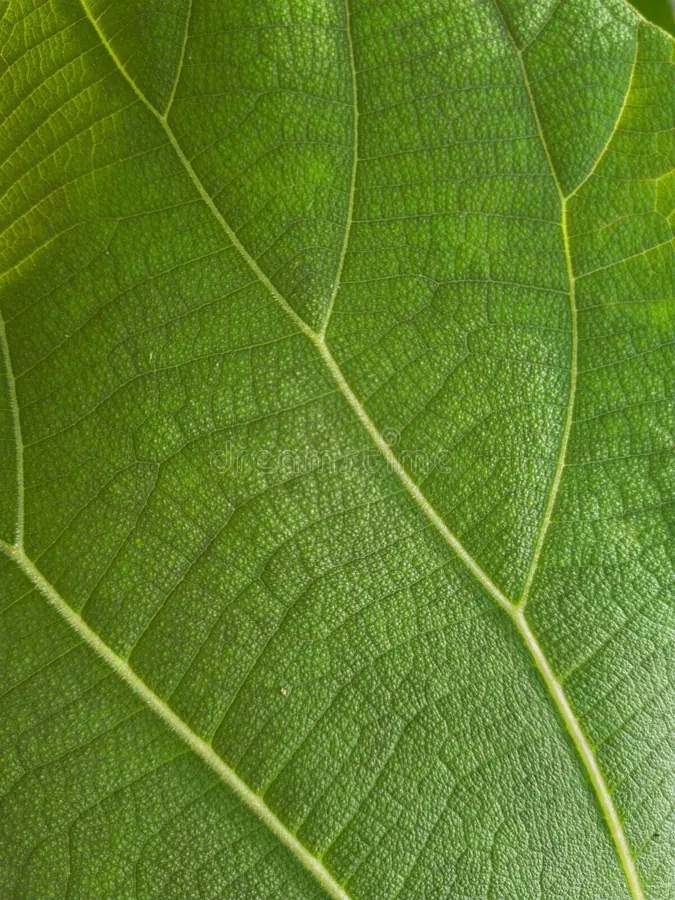 Healthy leaf
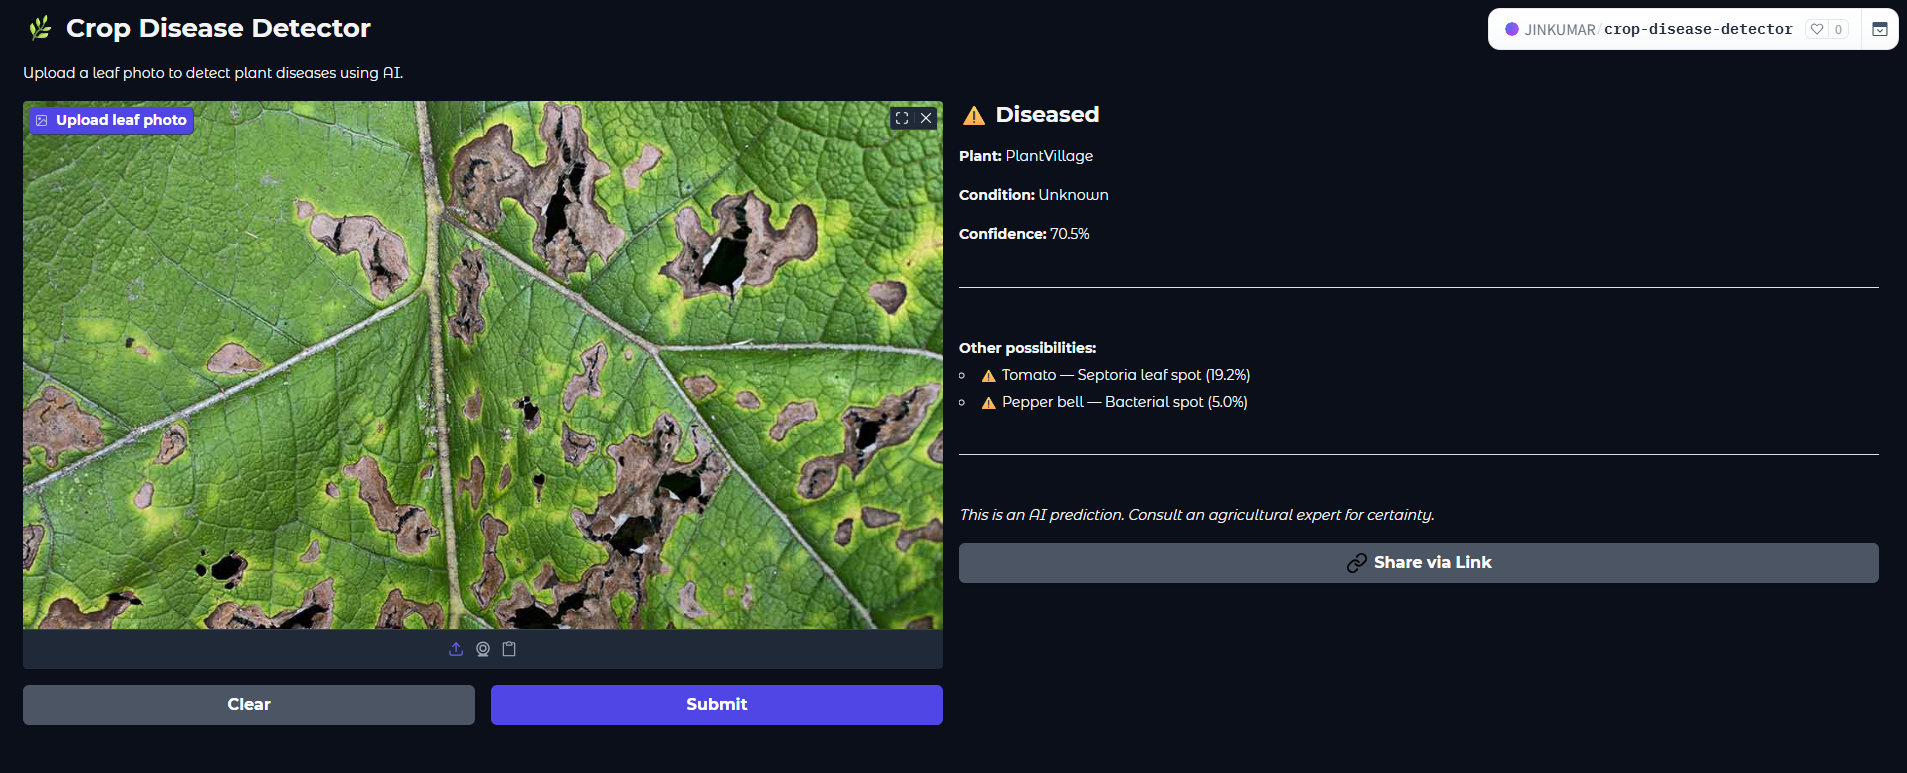
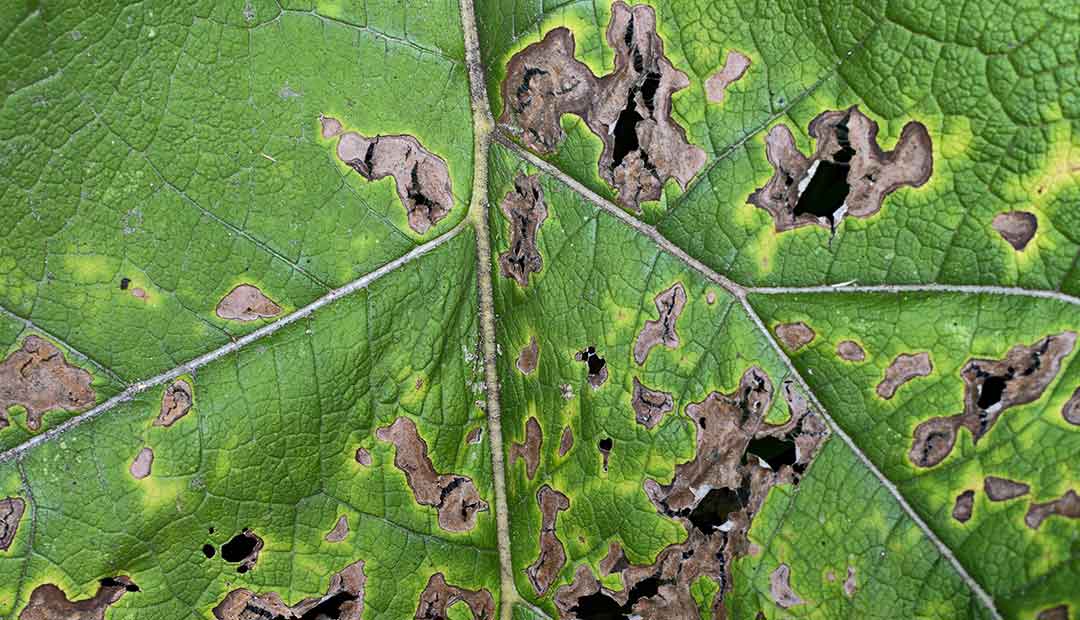 Diseased leaf
Plant diseases are difficult to diagnose visually — especially in the early stages. The differences between a healthy leaf and a diseased one can be subtle: a slight discolouration here, a texture shift there. Patterns too small and too inconsistent for the human eye to catch reliably across thousands of plants.
This is exactly the kind of problem that machine learning is built to solve. Not because AI is smarter than humans, but because it can process patterns at a scale and consistency that humans cannot.
That is the core insight behind this project — and the reason I found it worth building.
The Dataset
41,274 leaf photos, 16 disease classes, and what I learned from exploring the data before training anything.
The dataset I used is called PlantVillage — a publicly available collection of leaf images created specifically for plant disease research. It is available for free on Kaggle.
My version of the dataset contained:
The dataset covers multiple plant types including Tomato, Potato, Pepper, and others. Each class is a combination of plant and condition — for example: Tomato___Late_blight or Pepper___bell___healthy.
One thing I noticed immediately was the class imbalance. Some classes had over 4,000 images (Tomato Bacterial Spot: 4,254) while others had as few as 304 (Potato Healthy). This kind of imbalance matters — it can cause the model to "favour" the majority classes and struggle with rarer ones.
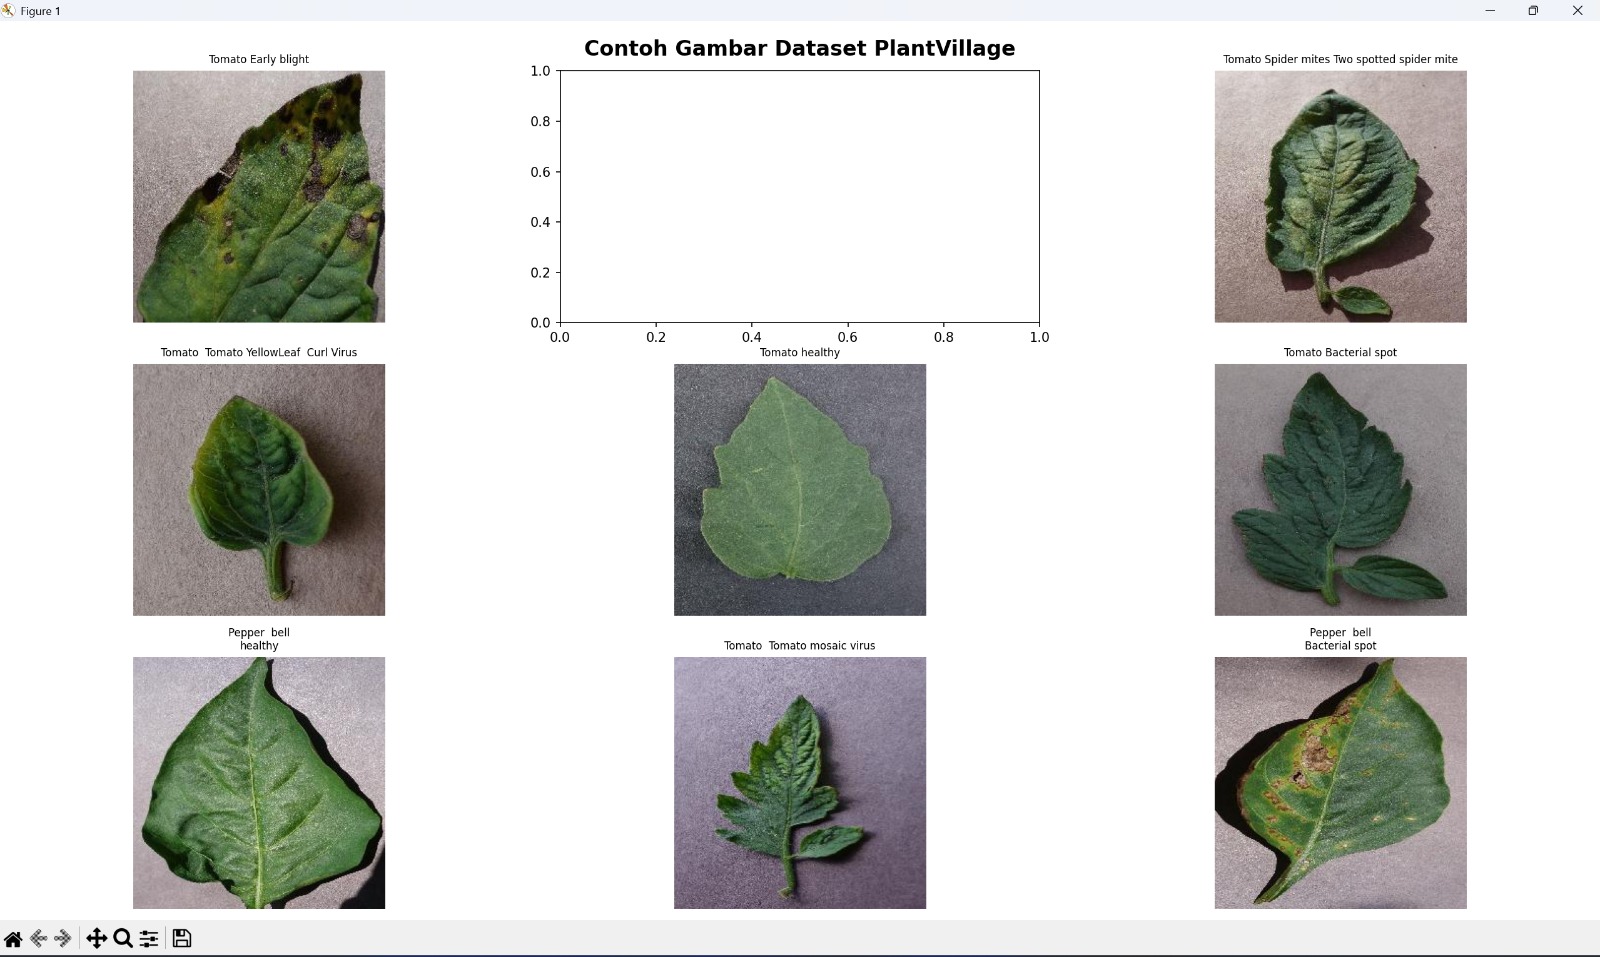
Sample images from the PlantVillage dataset — each class represents a unique plant-disease combination.
Understanding this upfront shaped how I approached the training process — specifically around data augmentation, which I'll cover in the next section.
To compensate for class imbalance and make the model more robust, I applied data augmentation during training. This means artificially creating variations of existing images by:
The goal was to force the model to learn the actual features of each disease — not just memorise the specific photos it was trained on.
The Model
Why I didn't build from scratch — and what Transfer Learning actually means in practice.
Building a deep learning model from scratch requires millions of images and weeks of training on expensive hardware. That was not an option for a semester 2 project running on a laptop with no GPU.
Instead, I used Transfer Learning — one of the most powerful ideas in modern machine learning.
Think of it like this: if you already know how to read, learning a new language is much faster than learning to read from scratch. The model already understands shapes, textures, edges, and patterns. I just needed to teach it what diseased leaves specifically look like.
The pre-trained model I chose is called MobileNetV2 — a lightweight neural network architecture designed to run efficiently even on mobile devices. It was pre-trained on ImageNet, a dataset of 14 million images across 1,000 categories.
My architecture looked like this:
The base MobileNetV2 was frozen at first — meaning its weights did not change during training. Only my custom layers on top were trained. This is called feature extraction.
In the second phase, I unfroze the last 20 layers of MobileNetV2 for fine-tuning — allowing the model to slightly adjust its understanding of images specifically for leaf disease patterns.
Training & Results
What the training graphs actually mean — and an honest account of what went wrong.
Training happened in two phases across 15 epochs on a standard laptop CPU — no GPU. Each epoch took roughly 3-4 minutes, making the total training time around 45-60 minutes.
Phase 1 trained only my custom layers on top of the frozen MobileNetV2 base. Phase 2 unfroze the last 20 layers for fine-tuning with a much lower learning rate.
The training accuracy reached around 57-58%, while validation accuracy peaked at around 31% before declining.
This gap is called overfitting.
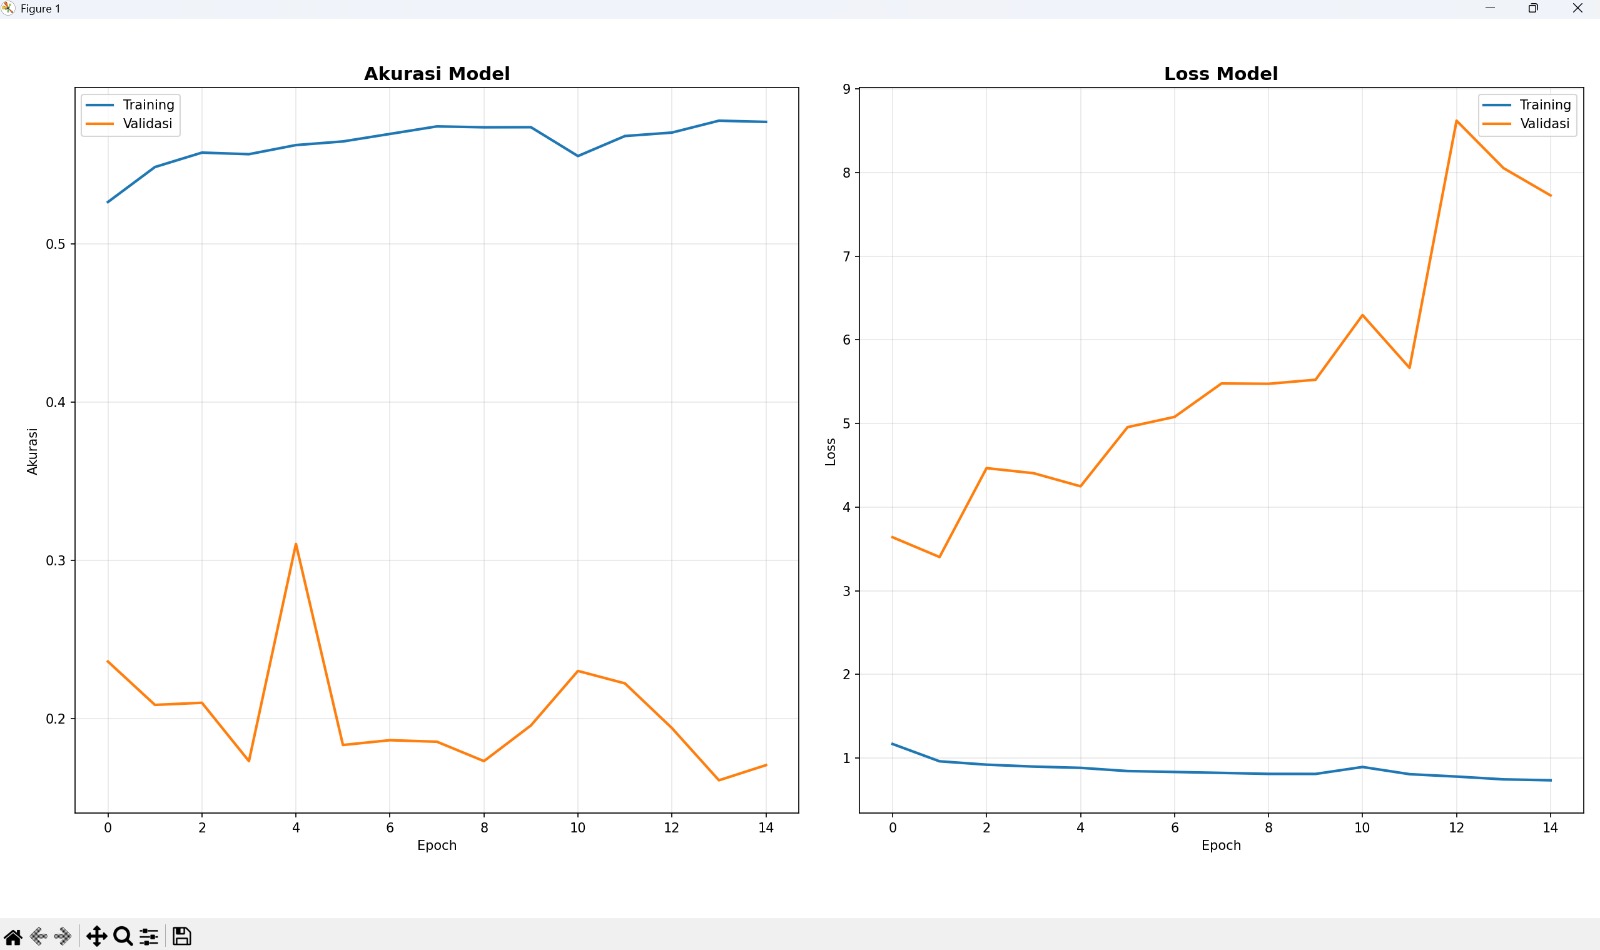
Training vs Validation accuracy & loss over 15 epochs — the diverging curves clearly show overfitting.
The analogy I keep coming back to: a student who memorises every past exam paper but fails when the questions change even slightly. The knowledge is there, but the understanding is not generalised.
Several factors contributed to the overfitting:
The Web App
Turning a trained model into something anyone can use — from Streamlit to Hugging Face Spaces.
A model that only runs locally on my laptop is not useful to anyone else. The point of this project was always to build something that could actually reach the people it was designed for.
So I built a web interface using Gradio — a Python library that lets you wrap any ML model in a clean, interactive UI with minimal code.
The flow is simple:
Demo: uploading a leaf photo and getting a disease prediction in real time.
Here are two real predictions I ran using the live app — one on a clearly diseased leaf, and one on a healthy one. This is exactly what a farmer (or anyone) would see after uploading a photo.
The app is deployed on Hugging Face Spaces — a free hosting platform for ML applications. It runs 24/7, accessible to anyone with a browser, without any login required.
The entire infrastructure stack:
What's Next
The lessons learned, what I would do differently, and where this project goes from here.
If I were to retrain this model today, these are the first things I would change:
Beyond the technical skills, this project taught me something more important: the difference between building something that works in a notebook and building something that works in the world.
Deploying a model — dealing with dependency conflicts, Python version mismatches, file format issues, and server environments — is a different skill entirely from training one. And it matters just as much.
This project is not perfect. The accuracy is lower than I want it to be. The overfitting is real. But it is live, it is functional, and it taught me more than any tutorial ever could.
The app is live. Upload a leaf photo — from your phone, from the internet, from your garden — and see what the model thinks.